Infinity Insights - Volume 16, Volume 3
MONTHLY UPDATE - MARCH 2026 EDITION
NATURAL GAS
Spot NYMEX Natural Gas has traded in a narrow range, around $2.85 to $3.55, after dramatic volatility caused by January’s Winter Storm Fern. Supply & demand paradigm appears to be loosening with a lighter than normal draw on natural gas inventories for week ending 3/6/26 and a surprise injection reported for week ending 3/13/26. Production remains robust. Current inventory is comfortable, 10% above the year ago mark and 2.6% above the 5-yr mark.
EIA’s Short-Term Energy Outlook is forecasting $3.80 US natural gas in 2026 and $3.90 in 2027 – both considerably lower than last month’s forecast. The report cites two reasons for the revised forecast. Firstly, milder than expected temperatures in February depressing seasonal demand, resulting in a light inventory withdraw season. Secondly, elevated oil prices are expected to increase domestic production which will lead to more associated gas, putting further downward pressure on natural gas. In analyzing the most recent EIA report, we can infer that the EIA model is assuming Strait of Hormuz transits will resume in Q3 2026.
Spot natural gas has support at $2.85 with resistance at $3.30.
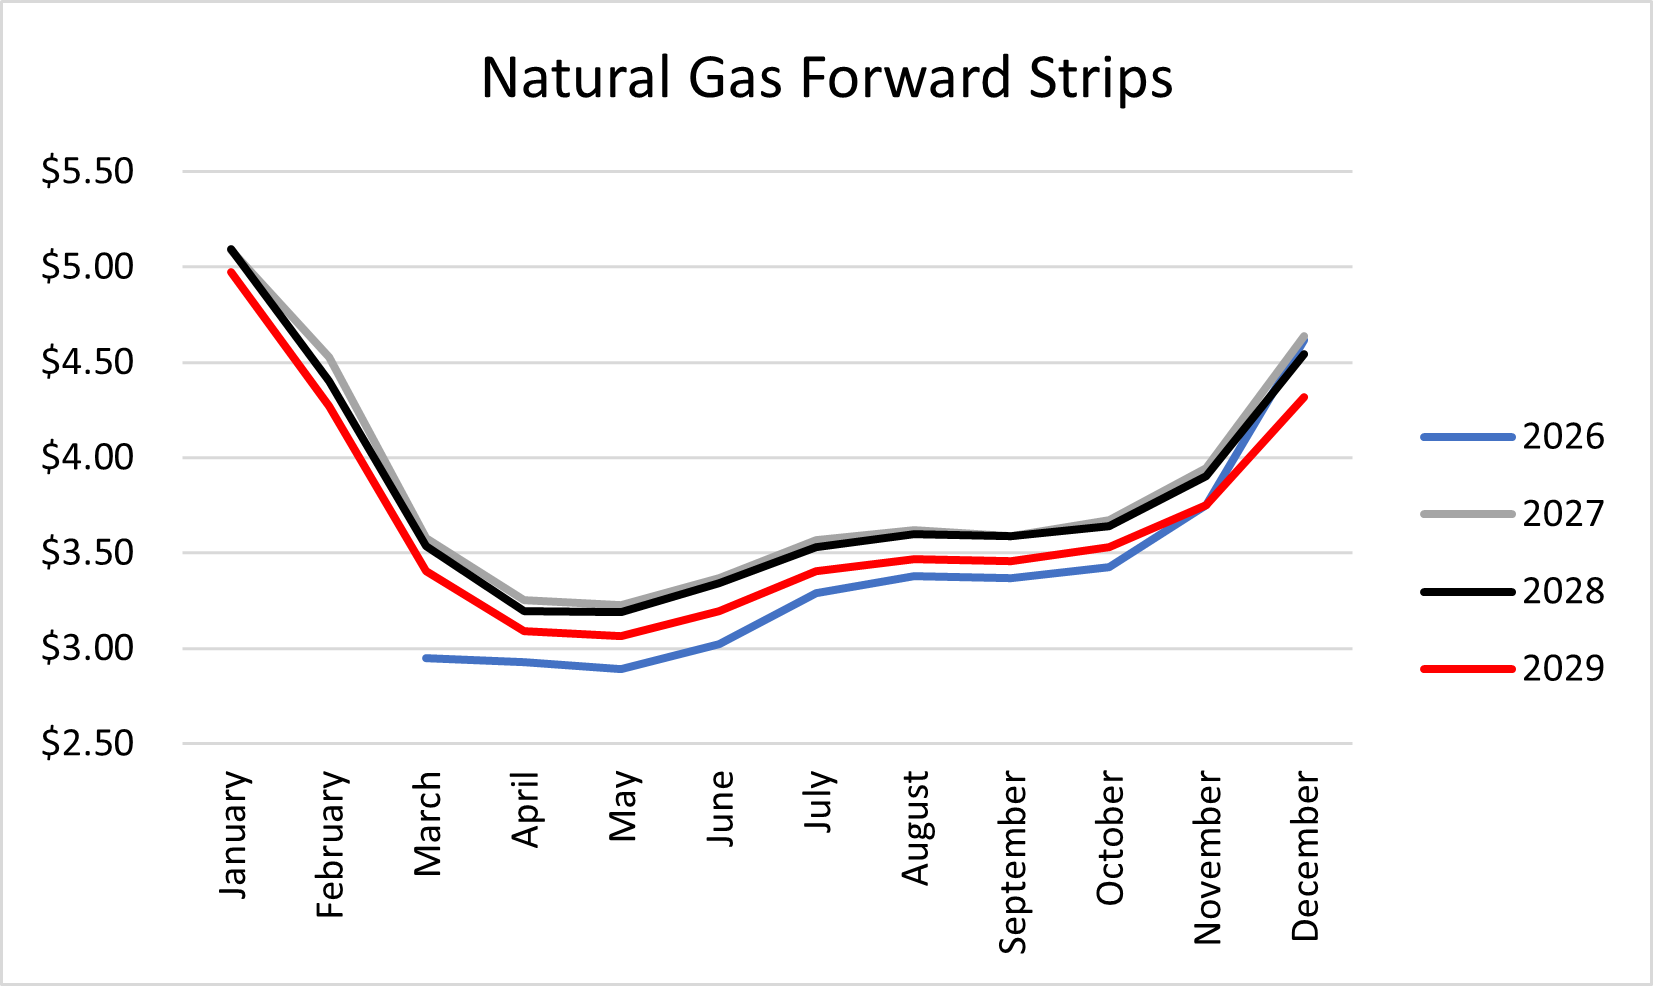
Balance year 2026 finds support at $2.89 with resistance at $4.60. Calendar year 2027 has support at $3.22 with resistance at $5.10. Calendar year 2028 has support at $3.19 with resistance at $5.10 – these future strips are slightly higher than our last publication.
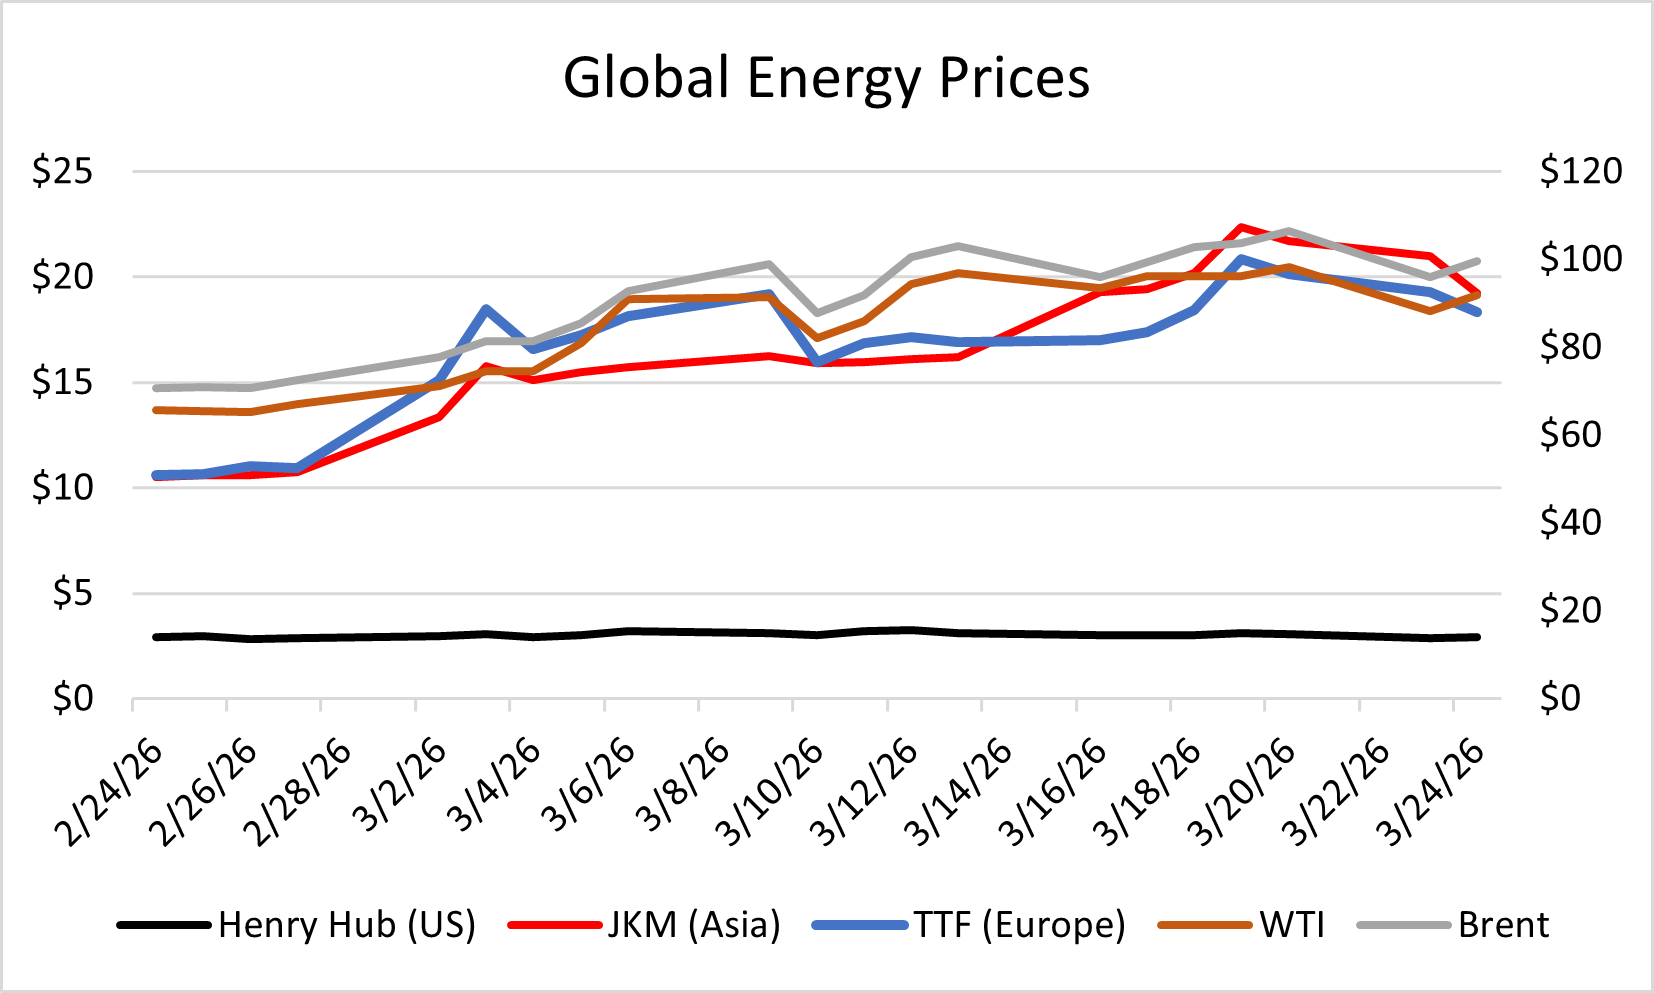
Global natural gas prices ($/MMBtu):
Henry Hub (USA): $2.95↑
NBP (UK): $18.28↑
TTF (Dutch) $17.31↑
JKM (Japan/Korea) $20.53↑
Global natural gas prices have gone parabolic with the recent supply chain disruption in the Middle East while domestic pricing has remained relatively flat.
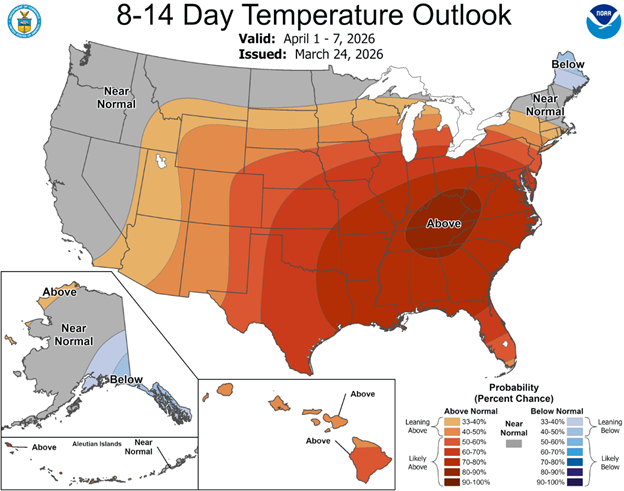
Weather
The 6-10 Day and 8-14 Day Temperature Outlook show above normal temperatures for the lower 48. Considering winter has come to an end and we are firmly within spring season, short-term weather forecasts will have less of an impact on cooling/heating demand or commodity prices.
NOAA’s summer forecast is showing above normal temperatures for the bulk of the US with near normal temperatures in the Great Lakes/Midwest regions.
Looking back at winter ‘26, on a population-weighted basis, November, December and February all came in mild with below normal heating degree days and January essentially in line with the historic mean.
Geopolitics Impacts on Energy
Oil and natural gas prices have been extremely volatile since the US and Israel started the latest campaign against the IRGC. Iran effectively closed maritime traffic in the Strait of Hormuz February 28. February 27 spot WTI and Brent closed at $67 and $72/bbl, respectively. March 8 both WTI and Brent peaked at $120 and $126/bbl, respectively. WTI and Brent are both up about 40% since the conflict began. Prior to this conflict the Strait carried about 20 million barrels per day (mb/d), the Strait is now only allowing passage for mainly Iranian oil exports, about 1.5 mb/d.
Strait of Hormuz carries about 20% of global LNG exports (a bit less than the global oil market share) with about 90% destined to Asia and 10% to Europe. Domestic natural gas (Henry Hub) has been mostly unaffected by the conflict. European and Asian natural gas are both up about 80%. This is mostly due to oil being a far more globalized and built out commodity. US natural gas production is robust while exports remain at near available liquifaction capacity, because of this the US is unable to export more LNG than what it was exporting prior to the conflict. On the other hand, oil terminals are readily available to ramp up exports and importers are better equipped to offload and receive shipments versus LNG which require capital intensive terminals that take years of construction.
As a result of the increased cost of oil, the US has seen a considerable increase at the pump. According to AAA, the national average for gasoline is $3.98/gallon and $5.35 for diesel, a 35% increase over a month. Asian markets have been far more impacted by the disruption. Sri Lanka, Bangladesh, Thailand and Myanmar have started fuel rationing. Pakistan, Sri Lanka and Vietnam have shifted to four-day work weeks for schools and public sectors while encouraging carpooling or work from home where possible. The United Kingdom has contingency plans to lower speed limits to reduce gasoline and diesel consumption.
Many of these disruptions are yet to be felt on the consumer level but surely will. According to Morgan Stanley, 45% of global sulfur transits Hormuz. This disruption will have implications on the agricultural sector as sulfur is an essential fertilizer. Southeast Asian countries have curtailed manufacturing in light of the shortages. How long this disruption will last is unknown but it’s difficult to consider an economic sector that won’t be impacted by the disruption. In general, a prolonged conflict will be highly inflationary on a global scale.
March 23 President Trump stated “the United States of America, and the country of Iran, have had, over the last two days, very good and productive conversations regarding a complete and total resolution of our hostilities in the Middle East”, signaling a de-escalation and potential off ramp to the conflict. Equity markets rallied on the announcement, gaining about 3% pre-market, while oil fell about $10/bbl. The impacts of this statement on commodities and equity have mostly remained, although there seems to be no actual de-escalation with targets on both sides spreading and intensifying.
Balcony Solar

Balcony solar or plug-in solar is a simple solution for households to supplement power demand. The system works by placing photovoltaic (PV) or solar panels on balconies or railing, typically one to three panels, connecting the panels to a microinverter, converting the current from DC to AC and then sending power to the household using an electrical outlet. These systems are more common in regions with expensive power and high population density.
The technology has existed and been implemented in a legally gray area since the mid-2010’s. In 2017 Germany’s main electrical certification body, The Verband Der Elektrotechnik, published the first guidelines for balcony solar, providing a safety and technical benchmark that allowed manufacturers to produce compliant kits. The 2017 guidelines helped push balcony solar to the mainstream, whereas before the solution was limited to innovative tinkerers and hobbyist electricians. The Covid shutdown helped accelerate balcony solar deployment as people gravitated towards DIY home projects. The biggest accelerant for balcony solar was Russia’s 2022 invasion of Ukraine which caused energy prices, particularly in Europe, to spike along with a general realization of the need for energy independence.
In the US, balcony solar deployment has been slow. This is due to comparatively inexpensive domestic power, stricter interconnection rules and a lack of full-system UL certification – often times components are individually certified but lack a full system UL certification.
In March 2025 Utah introduced and passed House Bill 340, which was then ratified by Gov. Spencer Cox in May 2025. The bill created a new category for “portable solar generation devices” up to 1,200 watts. Portable solar generation devices are exempt from utility interconnection agreements, permitting requirements and absolves utilities from liability for property issues with properly installed and certified devices. Virginia is closely trailing Utah with bills passing the House & Senate and awaiting signature by Gov. Abigail Spanberger. Utah’s passage of what is commonly known as “plug-and-play” legislation has caused a snowball effect with about 25 states currently considering similar legislature. Germany is the market leader in balcony solar with well over 1 million registered installations, while Utah leads the US at a few thousand installations.
Results will depend mostly on sun exposure and local power rates. For the sake of simplicity, we are looking at US averages. A two-panel system, producing 800-watts costs about $1,500. On average, in the US this setup will produce approximately 1,400 kWh per year. Average power costs are approximately $.16/kWh, producing about $244/year in power, representing a 6yr payback assuming a 5% annual increase in power costs. 6yr payback or 17% return on investment starts making a lot of sense considering the booming demand for power and the growing uncertainty in global energy markets.
Market News
February CPI ticked up to a seasonally adjusted .3% vs. .2% in January. March 2026 CPI data will be released April 10 and is expected to be elevated mainly due to higher gasoline costs. Odds of an April Federal Reserve cut to interest rates have all but vanished. February saw unemployment tick up to 4.4% vs. 4.3% in January. US equities are down 3.5%, YTD and off about 5% from all-time highs.