Infinity Insights – Volume 9, Issue 34
AT-A-GLANCE SUMMARY
NYMEX natural gas spot month (November) continued to retreat from the high of $2.75.
SUMMARY OF THE LAST WEEK IN CHARTS
Spot month natural gas (November) has support at 2.35 then 2.25, with resistance at 2.45, then 2.60. The calendar year 2020 has support at 2.36 with resistance 2.60. The calendar year 2021 has support at 2.40 with resistance at 2.48.For a look at our monthly market reports, visit Infinity Power Partner’s Market Overview.
RoadmapNYMEX natural gas spot month (November) closed $0.13 lower at $2.404.

What’s This? – The “Roadmap” is the price action chart depicting the NYMEX natural gas spot month. It’s important because it is essentially the trading community’s market sentiment.
Cal 2020Calendar 2020 settled ≈$0.06 down at $2.4475

What’s This? – “Cal 2020” is the first complete 12-month strip. It gives you a visual of price action and provides a reference point for our take on the market
Cal 2021Calendar 2021 finished at $2.4525, lower by ≈$0.025.
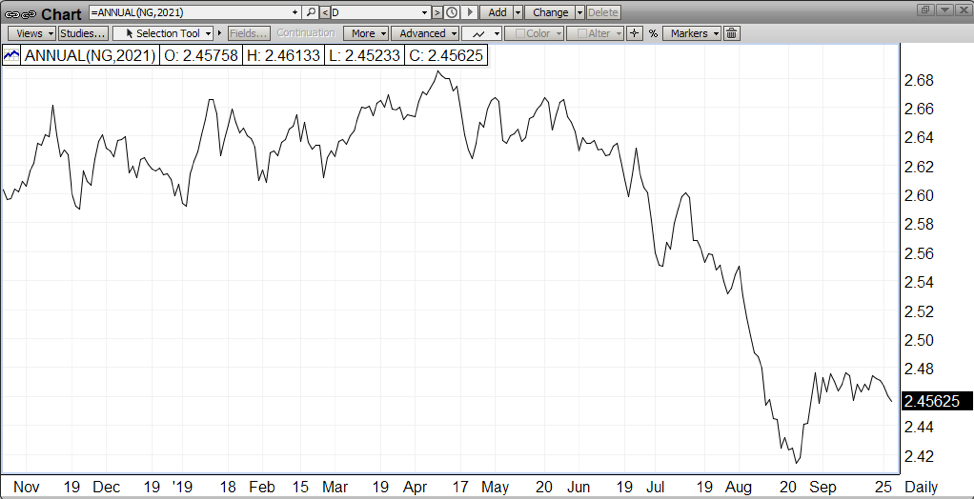
What’s This? – “Cal 2021” is the second complete 12-month strip. It gives you a visual of price action and provides a reference point for our take on the market.
OUR TAKE ON THE MARKET
NYMEX Natural GasNYMEX natural gas spot month (November) continued to retreat from the high of $2.75. Prices are ending the week close to $2.35 area of support. Indicators are negative but close to oversold area. As winter nears, current level of support will provide a good measure of the strength of the market.
WHOLESALE POWER


ERCOTThe forward curve moved slightly higher as winter nears.…even though natural gas fell up front, the increase in heat rates offset lower feed stock.PJMPretty much unchanged with pattern of lower front natural gas……and slightly higher heat rates.Support appears at current numbers for both PJM and ERCOT.