Infinity Insights – Volume 8, Issue 14
AT-A-GLANCE SUMMARY
Natural gas continues to trade in a relatively tight price band.
SUMMARY OF THE LAST WEEK IN CHARTS
Spot month natural gas (May) has support at 2.60 with resistance at 2.80 then 2.90 Calendar year 2019 has support at 2.70 with resistance at 2.76. Calendar year 2020 has support at 2.69 with resistance at 2.76.For a look at our monthly market reports, visit Infinity Power Partner’s Market Overview.
Roadmap
NYMEX natural gas spot month (May) settled at $2.739, up $0.004.

Roadmap
What’s This? – The “Roadmap” is the price action chart depicting the NYMEX natural gas spot month. It’s important because it is essentially the trading community’s market sentiment.
Cal 19
Calendar 2019 was lower by ≈$0.055 at $2.7475.

Cal 19
What’s This? – “Cal 19” is the first complete 12-month strip. It gives you a visual of price action and provides a reference point for our take on the market.
Cal 20
Calendar 2020 ended the week off ≈$0.06 at $2.708.

Cal 20
What’s This? – “Cal 20” is the second complete 12-month strip. It gives you a visual of price action and provides a reference point for our take on the market.
OUR TAKE ON THE MARKET

nng
ERCOT

ERCOT
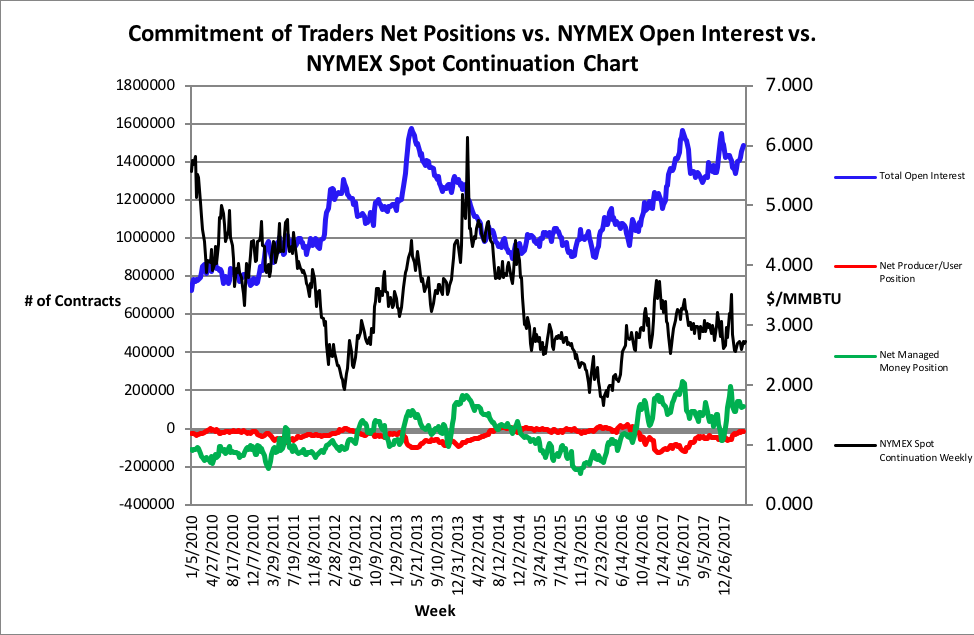
Natural gas continues to trade in a relatively tight price band. This has been the way of things since early February. Volatility has not been a factor. That has not always been the case.Natural gas, prior to mid-2008, was a commodity with a tight supply/demand balance. The search and discovery of natural gas was an offshore Gulf of Mexico big money venture, logistically challenged process many believed was the way of the future. In mid-2008, what had become a sector-wide price bubble, burst. This was a product of the major recession to the U.S. economy that eventually went global.Prior to the drop, natural gas displayed a tendency to trade between $2/MMBTU and $6/MMBTU (black lines on chart). If it traded above $6/MMBTU, it increased in volatility, usually spiking for a short term, and then returning to the $6 level. Price risk was real and often scary.After mid-2008 (red line on chart), the plummeting prices found buyers at the $3/MMBTU area and bounced. This bounce took prices back to the $6/MMBTU area. Coincidentally, unconventional recovery (fracking) exploded and onshore plays in tight formations were pursued. Oil and gas folks had long known there were hydrocarbons in these properties but couldn’t economically recover them. That changed when George Mitchell proved that the recovery could be made through a modification of tried and proven technology, namely hydraulic fracturing (“fracking”).The path for prices was orderly and defensive until early 2014 and the “polar vortex” episode that again propelled prices to $6/MMBTU. Since then, there’s been a retest of the $2/MMBTU area with an interim $4/MMBTU ceiling. Throughout this spot natural gas march, the back of the curve has moved lower and year-to-year strips have compressed to provide a very flat curve. And here we are.We’re technicians at IPP. We believe that all of the influences for natural gas pricing are accounted for in price action. We look at the chart above and clearly see the divergence from volatile and pricey times (pre mid-2008) and calmer and lower times. We don’t discount the possibility of higher prices, but likely in the confines of the $2 to $6 range. Looking at open interest and other indicators, there seems to be a subtle shift to bullish sentiment.Time will tell.