Infinity Insights – Volume 9, Issue 43
AT-A-GLANCE SUMMARY
Fridays following Thanksgiving have often been when unusually moves occur. Most of the trade is on holiday, something that opens door to inordinate swings.
SUMMARY OF THE LAST WEEK IN CHARTS
Spot month natural gas (January) has support at 2.27 with resistance at 2.50. Calendar year 2020 has support at 2.25 with resistance 2.38. Calendar year 2021 has support at 2.42 with resistance at 2.50.For a look at our monthly market reports, visit Infinity Power Partner’s Market Overview.
RoadmapNYMEX natural gas spot month (January) finished at $2.334, down $0.376 compared to the close of 11/22.

What’s This? – The “Roadmap” is the price action chart depicting the NYMEX natural gas spot month. It’s important because it is essentially the trading community’s market sentiment.
Calendar 2020Calendar 2020 ended the week ≈$0.1725 off at $2.303 compared to close two weeks ago.
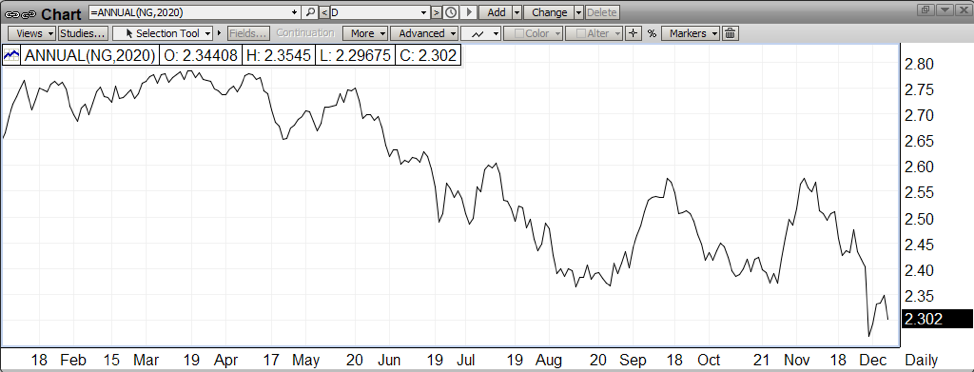
What’s This? – “Cal 2020” is the first complete 12-month strip. It gives you a visual of price action and provides a reference point for our take on the market.
Calendar 2021Calendar 2021 closed at $2.4425 lower by ≈$0.0325

What’s This? – “Cal 2021” is the second complete 12-month strip. It gives you a visual of price action and provides a reference point for our take on the market.
OUR TAKE ON THE MARKET
NYMEX Natural GasFridays following Thanksgiving have often been when unusually moves occur. Most of the trade is on holiday, something that opens door to inordinate swings. This year was no exception. Blaming changing weather forecasts, prices fell more than $0.20, closing at $2.281. This week saw that move countered, trading at $2.50, a meaningful technical area. Indicators remain bearish albeit oversold.
WHOLESALE POWER


ERCOTPrices remained firm until Friday where prices took a hit.How far of a pullback is likely linked to weather as natural gas will lead the way, up or down.PJMThe natural gas pullback is reflected in power prices as the charts below reflect:Weather will guide pricing.