Infinity Insights – Volume 9, Issue 28
AT-A-GLANCE SUMMARY
The biggest feature in ERCOT energy markets this week was two-fold: natural gas made new lows up front while heat rates made new highs in 2020 and signaled support in deferred tenures (terms).
SUMMARY OF THE LAST WEEK IN CHARTS
Spot month natural gas (September) has support at 2.10, with resistance at 2.32. Calendar year 2020 has support at 2.40 with resistance 2.50. Calendar year 2021 has support at 2.50 with resistance at 2.57.For a look at our monthly market reports, visit Infinity Power Partner’s Market Overview.
RoadmapNYMEX natural gas spot month (September) ended the week lower by $0.002 at $2119.

What’s This? – The “Roadmap” is the price action chart depicting the NYMEX natural gas spot month. It’s important because it is essentially the trading community’s market sentiment.
Cal 20Calendar 2020 was off by ≈$0.03 at $2.395.

What’s This? – “Cal 20” is the first complete 12-month strip. It gives you a visual of price action and provides a reference point for our take on the market.
Cal 21Calendar 2021 ended at $2.48, lower by ≈$0.05.
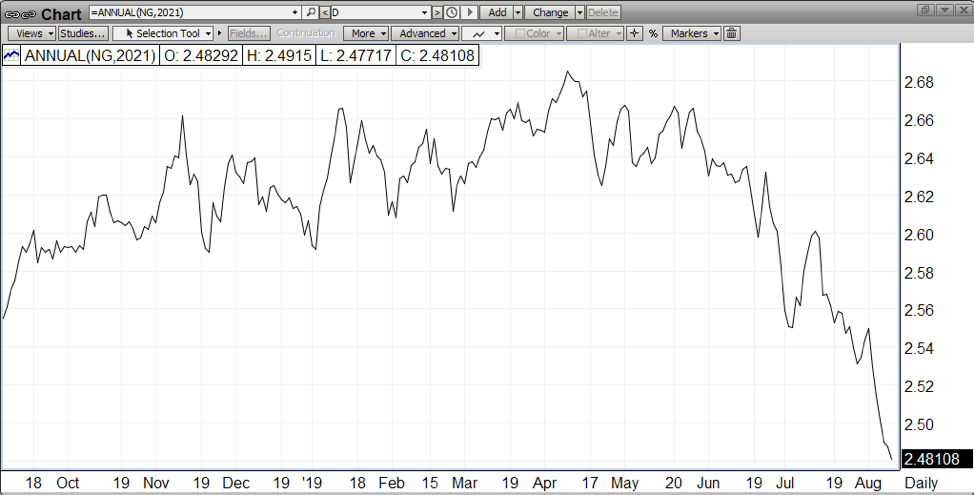
What’s This? – “Cal 21” is the second complete 12-month strip. It gives you a visual of price action and provides a reference point for our take on the market.
OUR TAKE ON THE MARKET


The biggest feature in ERCOT energy markets this week was two-fold: natural gas made new lows up front while heat rates made new highs in 2020 and signaled support in deferred tenures (terms).We believe the power markets are comfortable at current values and will attempt to remain in this area without intervening issues (weather?). Note that the heat rate values decline as one moves out in time. As mentioned before, we believe this is the natural consequence of growth of renewables and onsite generation.