Infinity Insights – Volume 9, Issue 15
AT-A-GLANCE SUMMARY
Spot NYMEX natural gas (June) held support at $2.50 as May expired.
SUMMARY OF THE LAST WEEK IN CHARTS
Spot month natural gas (June) has support at 2.50 with resistance at 2.63. Calendar year 2020 has support at 2.62 with resistance 2.74. Calendar year 2021 has support at 2.62 with resistance at 2.69.For a look at our monthly market reports, visit Infinity Power Partner’s Market Overview.
RoadmapNYMEX natural gas spot month (June) ended the week $0.045 higher at $2.58.

rd_9_15
What’s This? – The “Roadmap” is the price action chart depicting the NYMEX natural gas spot month. It’s important because it is essentially the trading community’s market sentiment.
Cal 20Calendar 2020 closed≈$0.0025 higher at $2.6775.

cal20_9_15
Calendar 2020 closed≈$0.0025 higher at $2.6775.
Cal 21Calendar 2021 settled ≈$0.015 higher at $2.645.

cal21_9_15
What’s This? – “Cal 21” is the second complete 12-month strip. It gives you a visual of price action and provides a reference point for our take on the market.
OUR TAKE ON THE MARKET

om1_9_15
om2_9_15.png

om3_9_15.png

om4_9_15.png

om5_9_15.png

om6_9_15.png

om7_9_15.png
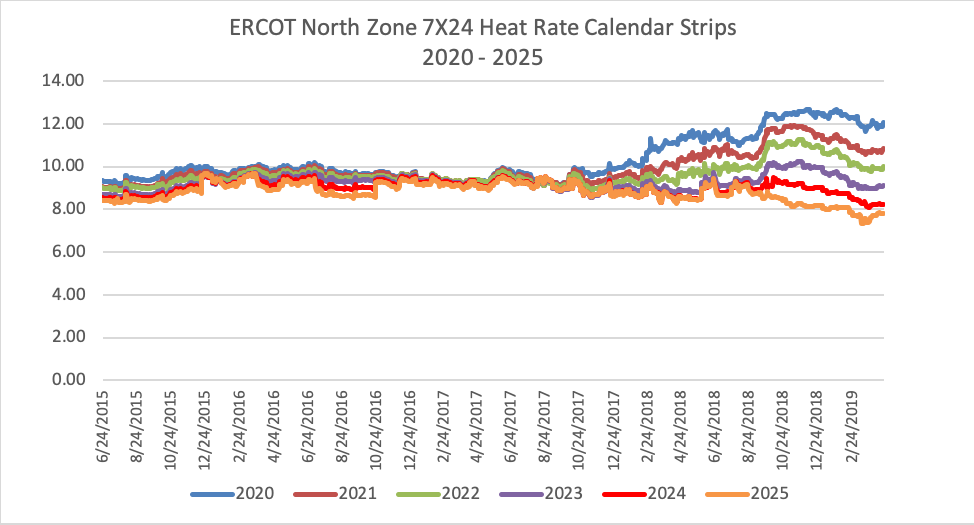
Spot NYMEX natural gas (June) held support at $2.50 as May expired. Thursday’s action appears to be a key reversal. We’ll see. As discussed in previous “Insights”, the important values are the deferred ones as these are where term procurement is made. Spot price is where one will find the greatest volatility and biggest moves, good for folks trading but not so much for power procurers.The transition of natural gas supply/demand from tightness to a world of plenty has exhibited itself in a tight band of values going out in time:Volatility has moved from feedstock to capacity cost with heat rates separating themselves by market-defined demand, the most up front:The result is a wholesale power price pattern very similar to the heat rate charts.The visual of forward curves of ERCOT power tells us that capacity is most in summer demand up front and demand scales back for the next 4 years (through 2024) until charts go flat from 2025 out. If one believes that grid-based capacity is giving way to onsite generation and renewable assets, then the picture is what you’d expect. This is our take. Even if you don’t have the same outlook, the forward curves are good benchmarks for alternative offerings. Note the following charts.First 5 years - 27.7Last 7 years - 22.712 year average - 24.9First 5 years - 30.56Last 7 years - 26.712 year average - 28.3First 5 years - 29Last 7 years - 24.212 year average - 26.3First 5 years - 25Last 7 years - 19.112 year average - 21.7