Infinity Insights – Volume 9, Issue 11
AT-A-GLANCE SUMMARY
Natural gas continued a sideway walk this week.
SUMMARY OF THE LAST WEEK IN CHARTS
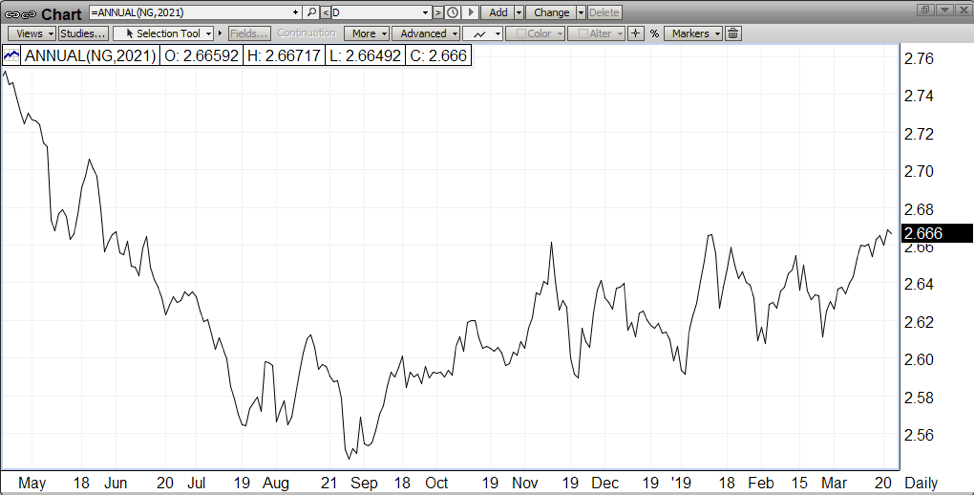
Spot month natural gas (April) has support at 2.75 with resistance at 3.00. Calendar year 2020 has support at 2.72 with resistance 2.78. Calendar year 2021 has support at 2.62 with resistance at 2.67.For a look at our monthly market reports, visit Infinity Power Partner’s Market Overview.
RoadmapNYMEX natural gas spot month (April) finished $0.042 lower at $2.753.

1
What’s This? – The “Roadmap” is the price action chart depicting the NYMEX natural gas spot month. It’s important because it is essentially the trading community’s market sentiment.
Cal 20Calendar 2020 closed unchanged at $2.765.

2
What’s This? – “Cal 20” is the first complete 12-month strip. It gives you a visual of price action and provides a reference point for our take on the market.
Cal 21Calendar 2021 also settled unchanged higher at $2.655.
3
What’s This? – “Cal 21” is the second complete 12-month strip. It gives you a visual of price action and provides a reference point for our take on the market.
OUR TAKE ON THE MARKET

4

5
Natural gas continued a sideway walk this week. No weather news and the beginning of spring adds little to volatility. We suspect this “ho hum” attitude to continue until and unless some impetus either way develops.Turning to ERCOT, heat rates look to be topping out up front.