Infinity Insights – Volume 8, Issue 33
AT-A-GLANCE SUMMARY
Spot NYMEX natural gas sold off to support at $2.75 and held.
SUMMARY OF THE LAST WEEK IN CHARTS
Spot month natural gas (October) has support at 2.75 then 2.70 with resistance at 2.88... Calendar year 2019 has support at 2.67 with resistance at 2.76. Calendar year 2020 has support at 2.60 with resistance at 2.67.For a look at our monthly market reports, visit Infinity Power Partner’s Market Overview.
Roadmap
NYMEX natural gas spot month (October) settled at $2.767, off $0.009.

rd1
What’s This? – The “Roadmap” is the price action chart depicting the NYMEX natural gas spot month. It’s important because it is essentially the trading community’s market sentiment.
Cal 19
Calendar 2019 finished at $2.694, down ≈$0.005.

c19
What’s This? – “Cal 19” is the first complete 12-month strip. It gives you a visual of price action and provides a reference point for our take on the market.
Cal 20
Calendar 2020 closed ≈$0.015 firmer at $2.615.
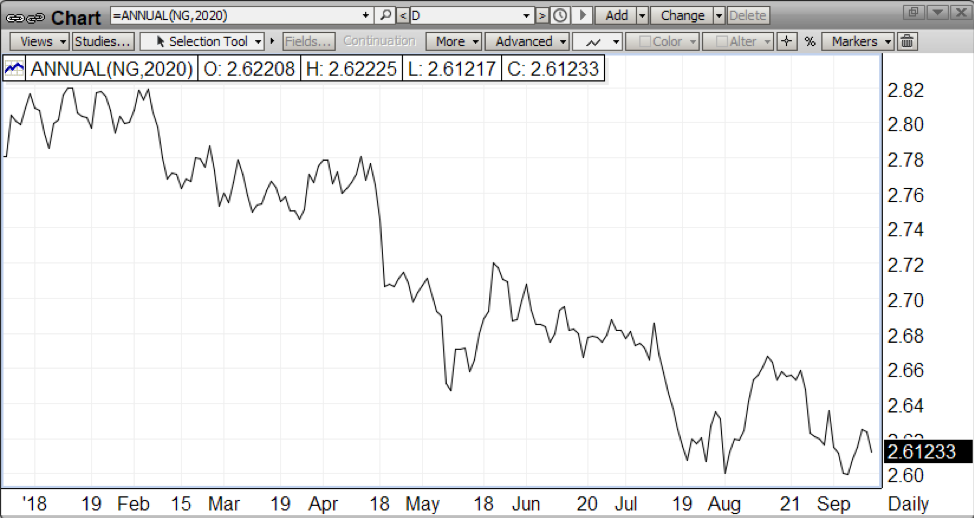
c20
What’s This? – “Cal 20” is the second complete 12-month strip. It gives you a visual of price action and provides a reference point for our take on the market.
OUR TAKE ON THE MARKET
Spot NYMEX natural gas sold off to support at $2.75 and held. Short covering has been a feature. The roughly $0.25 trading range ($3.00 to $2.75) remains intact. Currently, there doesn’t appear to be sufficient impetus to break out or break down from the discussed range.Looking ahead to winter, opinions are mixed with some looking for a much colder, much longer winter (others aren’t, hence a market). Should that occur, it would be evidenced in the first three contracts. The possibility of price spikes up front would likely see weakness in deferred values. Weather will be the catalyst, either bullish or bearish.Price action versus open interest shows increased positions while price churn sideways.

values
Our interpretation is that pressure is building for a move up from current range.