Infinity Insights – Volume 8, Issue 27
AT-A-GLANCE SUMMARY
Spot month NYMEX natural gas (September) held support at $2.70 and moved higher.
SUMMARY OF THE LAST WEEK IN CHARTS
Spot month natural gas (September) has support at 2.70 then 2.60 with resistance at 2.88. Calendar year 2019 has support at 2.70 with resistance at 2.75. Calendar year 2020 has support at 2.60 with resistance at 2.65.For a look at our monthly market reports, visit Infinity Power Partner’s Market Overview.
Roadmap
NYMEX natural gas spot month (September) closed up $0.054.at $2.782.

1
What’s This? – The “Roadmap” is the price action chart depicting the NYMEX natural gas spot month. It’s important because it is essentially the trading community’s market sentiment.
Cal 19
Calendar 2019 moved higher, closing at $2.74, up ≈$0.032.

2
What’s This? – “Cal 19” is the first complete 12-month strip. It gives you a visual of price action and provides a reference point for our take on the market.
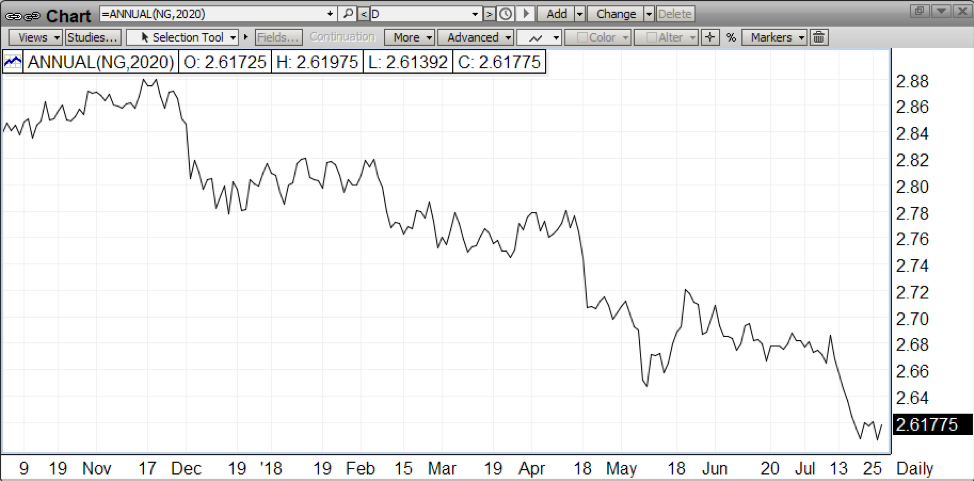
Cal 20
Calendar 2020 finished off ≈$0.02 at $2.6275.
3
What’s This? – “Cal 20” is the second complete 12-month strip. It gives you a visual of price action and provides a reference point for our take on the market.
OUR TAKE ON THE MARKET
Spot month NYMEX natural gas (September) held support at $2.70 and moved higher. Price action has been with low volatility. $2.90 appears as next resistance. Back of the curve values remain defensive.Weather extremes continue to drive price actionResources for summer weather information:https://www.weatheramerica.net/https://www.wunderground.com/newshttps://wgntv.com/weather/http://www.aoml.noaa.gov/phod/cyclone/data/https://www.weather.gov/https://www.nhc.noaa.gov/http://www.goes.noaa.gov/http://moe.met.fsu.edu/tcgengifs/