Infinity Insights – Volume 8, Issue 23
AT-A-GLANCE SUMMARY
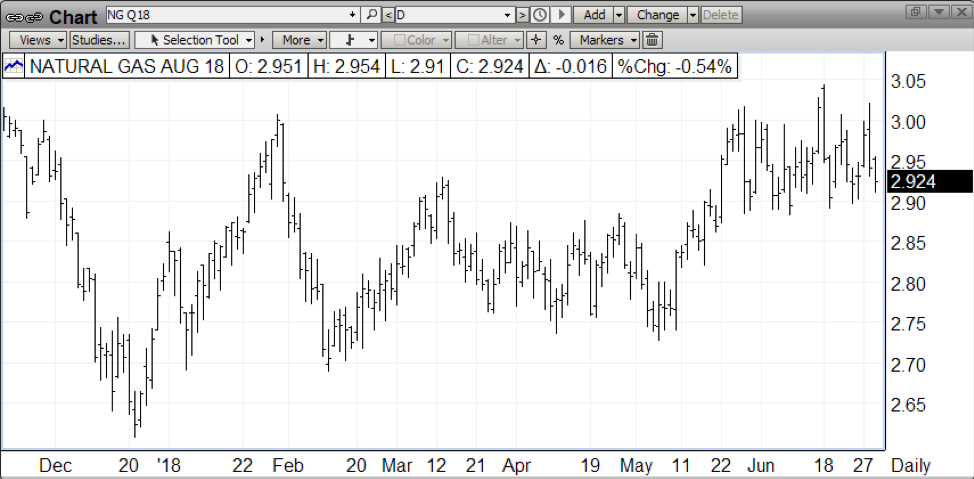
NYMEX natural gas spot month (August) continues to be stuck between $3 and $2.90.
SUMMARY OF THE LAST WEEK IN CHARTS
Spot month natural gas (August) has support at 2.90 then 2.85 with resistance at 3.00. Calendar year 2019 has support at 2.77, then 2.72 with resistance at 2.83. Calendar year 2020 has support at 2.65 with resistance at 2.72.For a look at our monthly market reports, visit Infinity Power Partner’s Market Overview.
Roadmap
NYMEX natural gas spot month (August) was down $0.0721, closing at $2.924.
1
What’s This? – The “Roadmap” is the price action chart depicting the NYMEX natural gas spot month. It’s important because it is essentially the trading community’s market sentiment.
Cal 19
Calendar 2019 closed at $2.805, lower by ≈$0.0025.

2
What’s This? – “Cal 19” is the first complete 12-month strip. It gives you a visual of price action and provides a reference point for our take on the market.
Cal 20
Calendar 2020 was firmer by ≈$0.005 at $2.6825.

3
What’s This? – “Cal 20” is the second complete 12-month strip. It gives you a visual of price action and provides a reference point for our take on the market.
OUR TAKE ON THE MARKET

4
NYMEX natural gas spot month (August) continues to be stuck between $3 and $2.90. Open interest has grown since July expired, suggesting that buyers and sellers are balanced. Weather will likely be the driver when prices break up or down from current range.Power pricing in ERCOT has been static with 2019 RTC heat rates falling to 2020 levels. This is in contrast to 2019 carrying a 1.5+ premium a month ago.