Infinity Insights - Volume 13, Issue 12
AT-A-GLANCE SUMMARY
Natural gas continues to trade sideways.
SUMMARY OF THE LAST WEEK IN CHARTS
Spot month natural gas (May) support at 2.00 with resistance at 3.25. Calendar year 2024 finds support at 3.40 with resistance at 4.00. Calendar year 2025 has support at 4.20 with resistance at 4.65.
Roadmap
NYMEX natural gas spot month (May) finished down by $0.122 at $2.216
Compared to close last Friday

Cal 2024
Calendar 2024 settled better by ≈$0.085 at $3.805
Compared to close last Friday

Cal 2025
Calendar 2025 ended higher by ≈$0.045 at $4.165
Compared to close last Friday

The “Widow Maker”
2024
Volatility…

OUR TAKE ON THE MARKETS
NYMEX Natural Gas
Natural gas continues to trade sideways. Our view is that, barring a systemic failure of the economy, prices should hold current lows. Buying pullbacks continues to be our recommendation.
Power prices have traded stronger than natural gas might suggest, the culprit being higher heat rates (i.e., higher demand for generation). In order to take a closer look, we provide detail in Wholesale Power, below.
WHOLESALE POWER
ERCOT
The charts of the power curve and its component pieces:

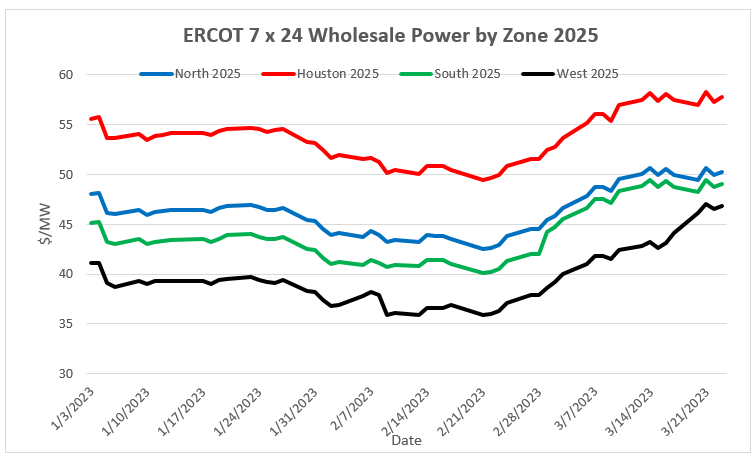


Note that the path of power prices results in values firmer as we go out in time led by heat rates (a notional rise of 1) while natural gas does not penetrate recent highs. The significance is the time of the year (summer is approaching).
PJM
Natural gas leads direction.