Infinity Insights-Volume 10, Issue 19
AT-A-GLANCE SUMMARY
Spot NYMEX natural gas (June) failed to support at 1.80, moving to an all-time low at 1.60.
SUMMARY OF THE LAST WEEK IN CHARTS
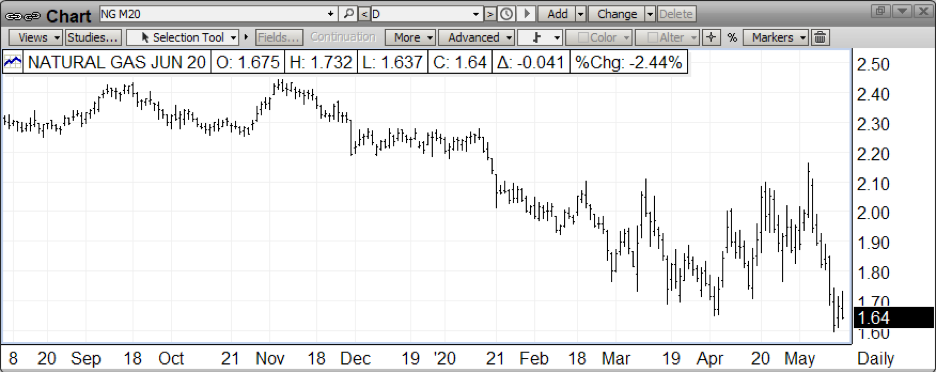
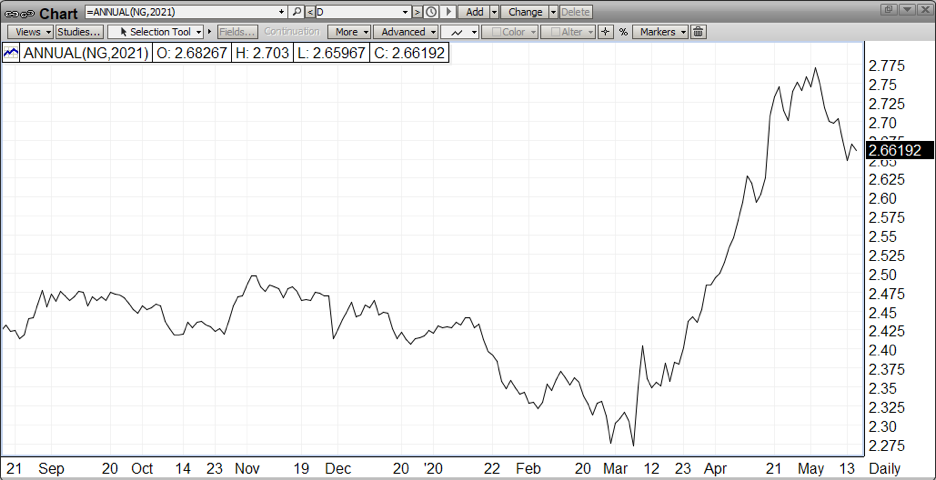

Spot month natural gas (June) has support at 1.60 with resistance at 180.Calendar year 2021 finds support at 2.60 then 2.50 with resistance at 2.75. Calendar year 2022 has support at 2.40 with resistance at 2.55.RoadmapNYMEX natural gas spot month (June) was down by $0.177at $1.646 compared to last Friday’s close.Calendar 2021Calendar 2021 settled ≤$0.034 off at $2.6635.Calendar 2022Calendar 2022 finished down by ≤$0.015 at $2.49.
OUR TAKE ON THE MARKET
NYMEX Natural Gas
Spot NYMEX natural gas (June) failed to support at 1.80, moving to an all-time low at 1.60. Values for Calendar 2021 also retreated, albeit not to the degree of spot. Volume increased dramatically on Tuesday and open interest climbed. Subsequent trade has been below 1.75 and above 1.60. The 30,000 ft. view suggests consolidation at current levels based on the spot continuation chart:

However, note that prices are contangoed for the balance of 2020, which might see the higher prices converge to current lower spot levels:
Jun-20
1.681
Jul-20
1.884
Aug-20
1.985
Sep-20
2.043
Oct-20
2.137
Nov-20
2.431
Dec-20
2.823
No easy answers for balance of year.
WHOLESALE POWER
ERCOT
It has been a unique and sometimes baffling 2020 so far. In order to bring things into perspective, we offer the following data:


Note that prices have traded in a fairly narrow range with lows in early February and highs in mid- April. The average price is within $1 of the current prices. Cal 2025 is approximately $4 under Cal 2021, meaning that longer-term offers lower prices.Regardless of your need to do something immediately, this data will provide reference points for decisions. More information is better.
PJM
PJM continues to mirror natural gas with little fireworks.