Infinity Insights- Volume 10, Issue 13
AT-A-GLANCE SUMMARY
Natural gas seems to be trading in two tranches: first, the balance of 2020, and second, from 2021 out.
SUMMARY OF THE LAST WEEK IN CHARTS


Spot month natural gas (May) has support at 1.50 with resistance at 1.75.Calendar year 2021 finds support at 2.45 with resistance at 2.60. Calendar year 2022 has support at 2.35 with resistance at 2.42.RoadmapNYMEX natural gas spot month (May) was off by $0.05 at $1.621 compared to last Friday’s close.Calendar 2021Calendar 2021 settled ≤$0.06 better at $2.51.Calendar 2022Calendar 2022 was unchanged closing at $2.39.
OUR TAKE ON THE MARKET
NYMEX Natural Gas
Natural gas seems to be trading in two tranches: first, the balance of 2020, and second, from 2021 out. The first part is trading in concert with COVID – 19 issues and concerns and the second is trading in a bullish configuration (backwardated). This suggests to us that there’s an expected return to “normal” after the virus and it looks constructive.There’s no absolute in our analysis as we’re still in the midst of the black swan event. However, produced gas from crude production will likely be lower as there’s not much crude storage available. In addition, questions remain as to what level of production will continue from natural gas plays. There are lots of questions, but few answers.
WHOLESALE POWER
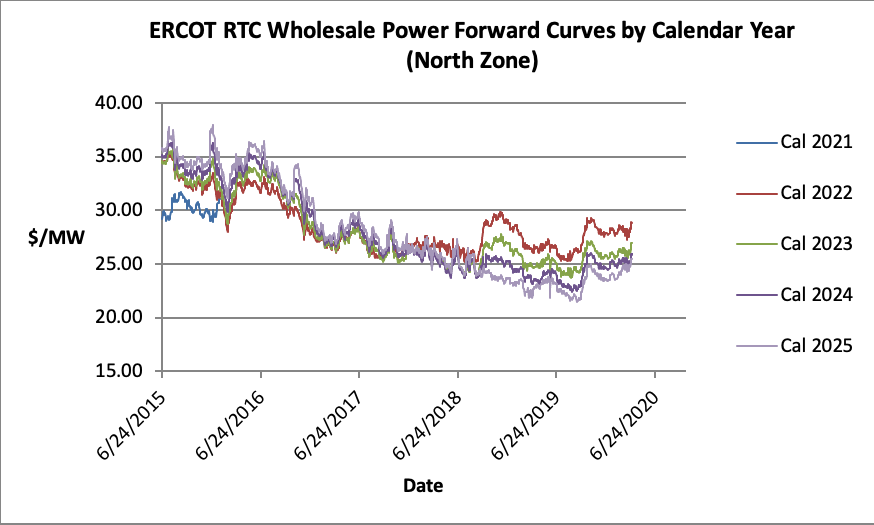
ERCOT
Charts point to a bullish trend developing and prices are <$5 from the bottom.
Natural gas open interest has steadied from its drop over the last two weeks and suggests new buying coming in.
PJM
Prices remain aligned with natural gas.